Games · Updated 17 August 2026
Slot machines: from reels to number generators
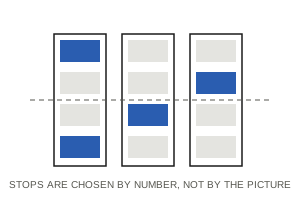
The pictures on the reels are a display. The outcome is chosen from a table of numbers before the reels appear to move.
Mechanical beginnings
The earliest machines were exactly what they looked like: three physical reels, each with a fixed number of symbol positions, stopped by springs and detents. With three reels of twenty stops there were 8,000 combinations, and the paytable was calculated directly from that count. The design constraint was severe -- a large jackpot required either very few winning combinations or very small other prizes.
Weighting and virtual reels
Electromechanical and then electronic machines removed the constraint by separating the outcome from the physical strip. A machine can hold an internal list in which a symbol occupies many entries and the jackpot symbol occupies one, then map the drawn entry onto a reel position for display. Two symbols that appear equally often on the visible strip may have quite different probabilities. This is what allows a large top prize alongside a modest advertised return.
It is also the reason near misses carry no information. If a jackpot symbol lands just above the payline more often than chance on the visible strip would suggest, that is a property of the mapping, not a sign that the machine is warming up. Each spin draws afresh.
Where the numbers come from
Modern machines use a pseudorandom number generator: a deterministic algorithm producing a sequence that passes statistical tests for randomness, cycling continuously whether or not anyone is playing, with the value read at the instant the spin is committed. Because it runs constantly and is read at an unpredictable moment, the outcome is not practically predictable, and the sequence's statistical properties are what testing regimes examine.
| Stated return | Edge | Expected cost of 1,000 units staked | Arithmetic |
|---|---|---|---|
| 99% | 1.0% | 10 units | 1000 x 0.010 |
| 96% | 4.0% | 40 units | 1000 x 0.040 |
| 92% | 8.0% | 80 units | 1000 x 0.080 |
| 88% | 12.0% | 120 units | 1000 x 0.120 |
Return, hit frequency and volatility
Return to player is an average over an enormous number of spins -- typically millions -- and says nothing about a session. Hit frequency is how often a spin returns anything, which may be a fraction of the stake. Volatility describes the spread: a low-volatility game returns small amounts often, a high-volatility game returns almost nothing for long stretches and occasionally a great deal. Three machines can share a 96 per cent return and feel like entirely different games.
A subtlety follows from hit frequency. A spin that returns less than the amount staked is displayed with the same celebration as a genuine win, so the recorded frequency of 'wins' can be far higher than the frequency of profitable spins. The arithmetic of the return figure already accounts for this; the presentation does not.
What this does not tell you
Return figures are long-run averages published for a machine configuration, not a promise about play. This page describes how the mechanism works and does not assess any machine, product or company.